Overview of the Analytics Dashboards
The  Analytics menu is your starting point for traffic analysis. It contains three dashboards that provide a quick overview of the network:
Network
Assets
Policy
Note
cognitix Threat Defender stores reporting data of up to the last 30 days (in 6-hour resolution).
The dashboards provide the most important information at a glance and allow you to drill down deeper into the reporting.
Drilling into the Network screen.
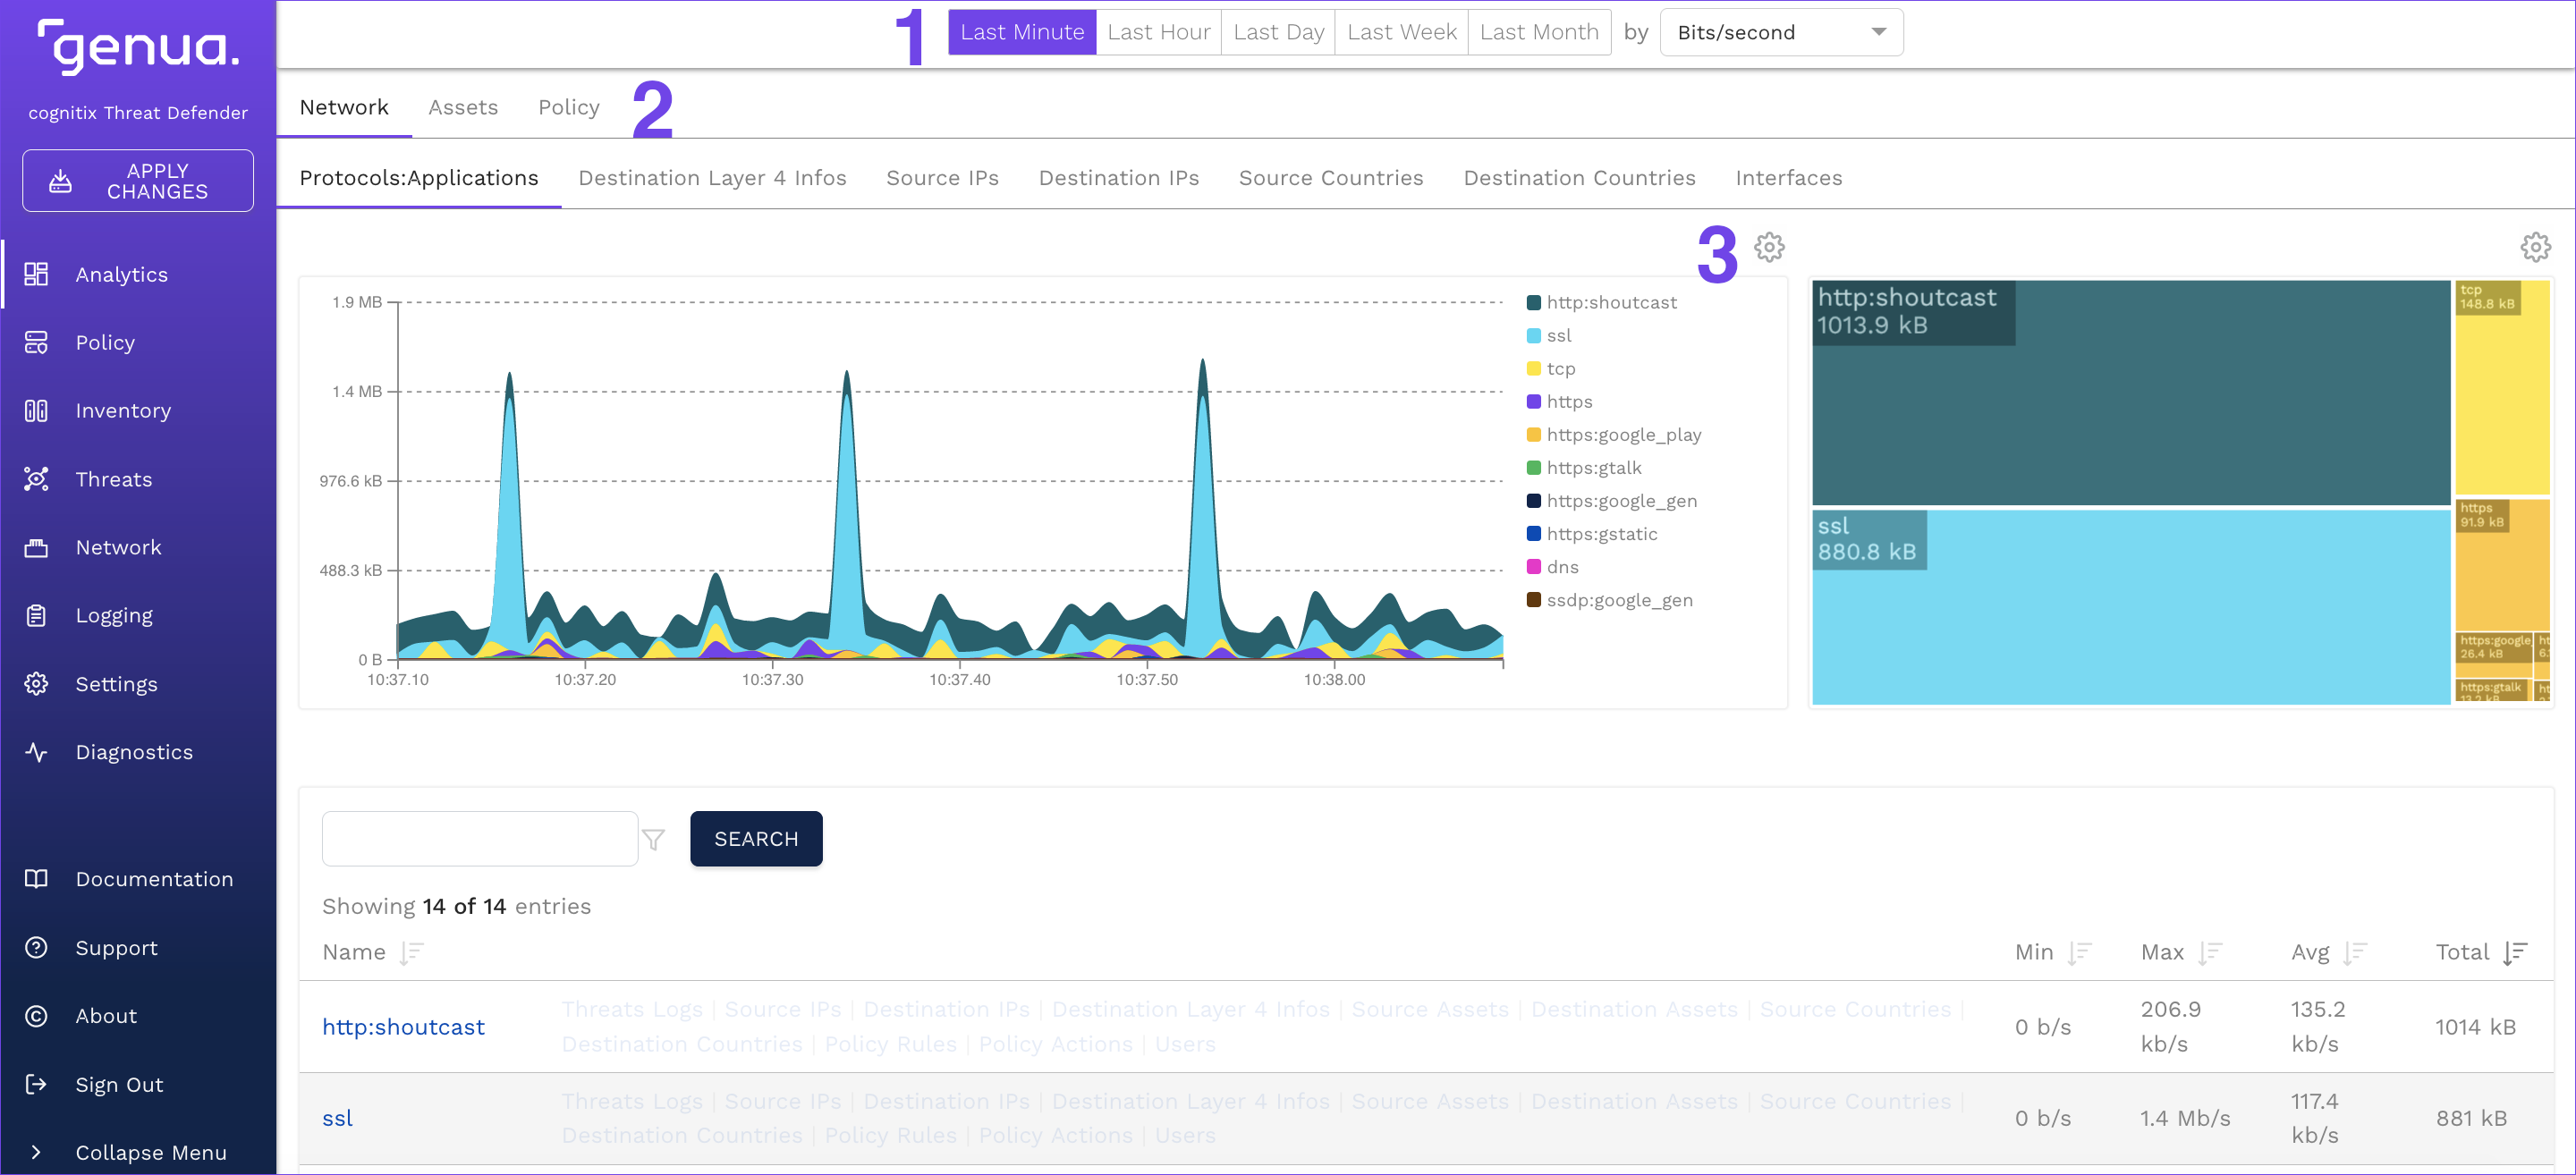
The Analytics screens contain the following control elements:
With the buttons at the top of the content area, you can select the reporting period to be displayed in the charts. When you drill into deeper reporting levels, you can also select the metric from a drop-down list. These settings are automatically applied to all charts under Analytics. There are up to five reporting periods with individual resolutions:
Last Minute in 1-second resolution (live view)
Last Hour in 1-minute resolution
Last Day in 15-minute resolution
Last Week in 3-hour resolution
Last Month in 6-hour resolution
If you drill deeper into the reporting, a breadcrumb trail above the charts displays the reporting levels you navigated.
The
 icon at the top of the charts allows you to change the chart type by selecting a new type from the drop-down list.
In most charts, you can hover the mouse over a section to see the represented value in a tooltip.
Tip
If you hover the mouse over a chart, it pauses and is no longer updated. This gives you time to analyze the chart. This is particularly helpful if you set the charts to a small resolution.
Many chart headings are links. Click them to see further information regarding that specific chart. The link takes you to a deeper level of analysis, where you see time and quantity-based charts as well as a table view of the entries. You can also directly click a section of a chart or a table entry to navigate to the relevant reporting screen.
Note
Information on Source Countries and Destination Countries is based on GeoIP values. If you use a private IP range, the source and/or destination country is displayed as Unknown or invalid territory.
See the following chapters for further information on the three dashboards: